
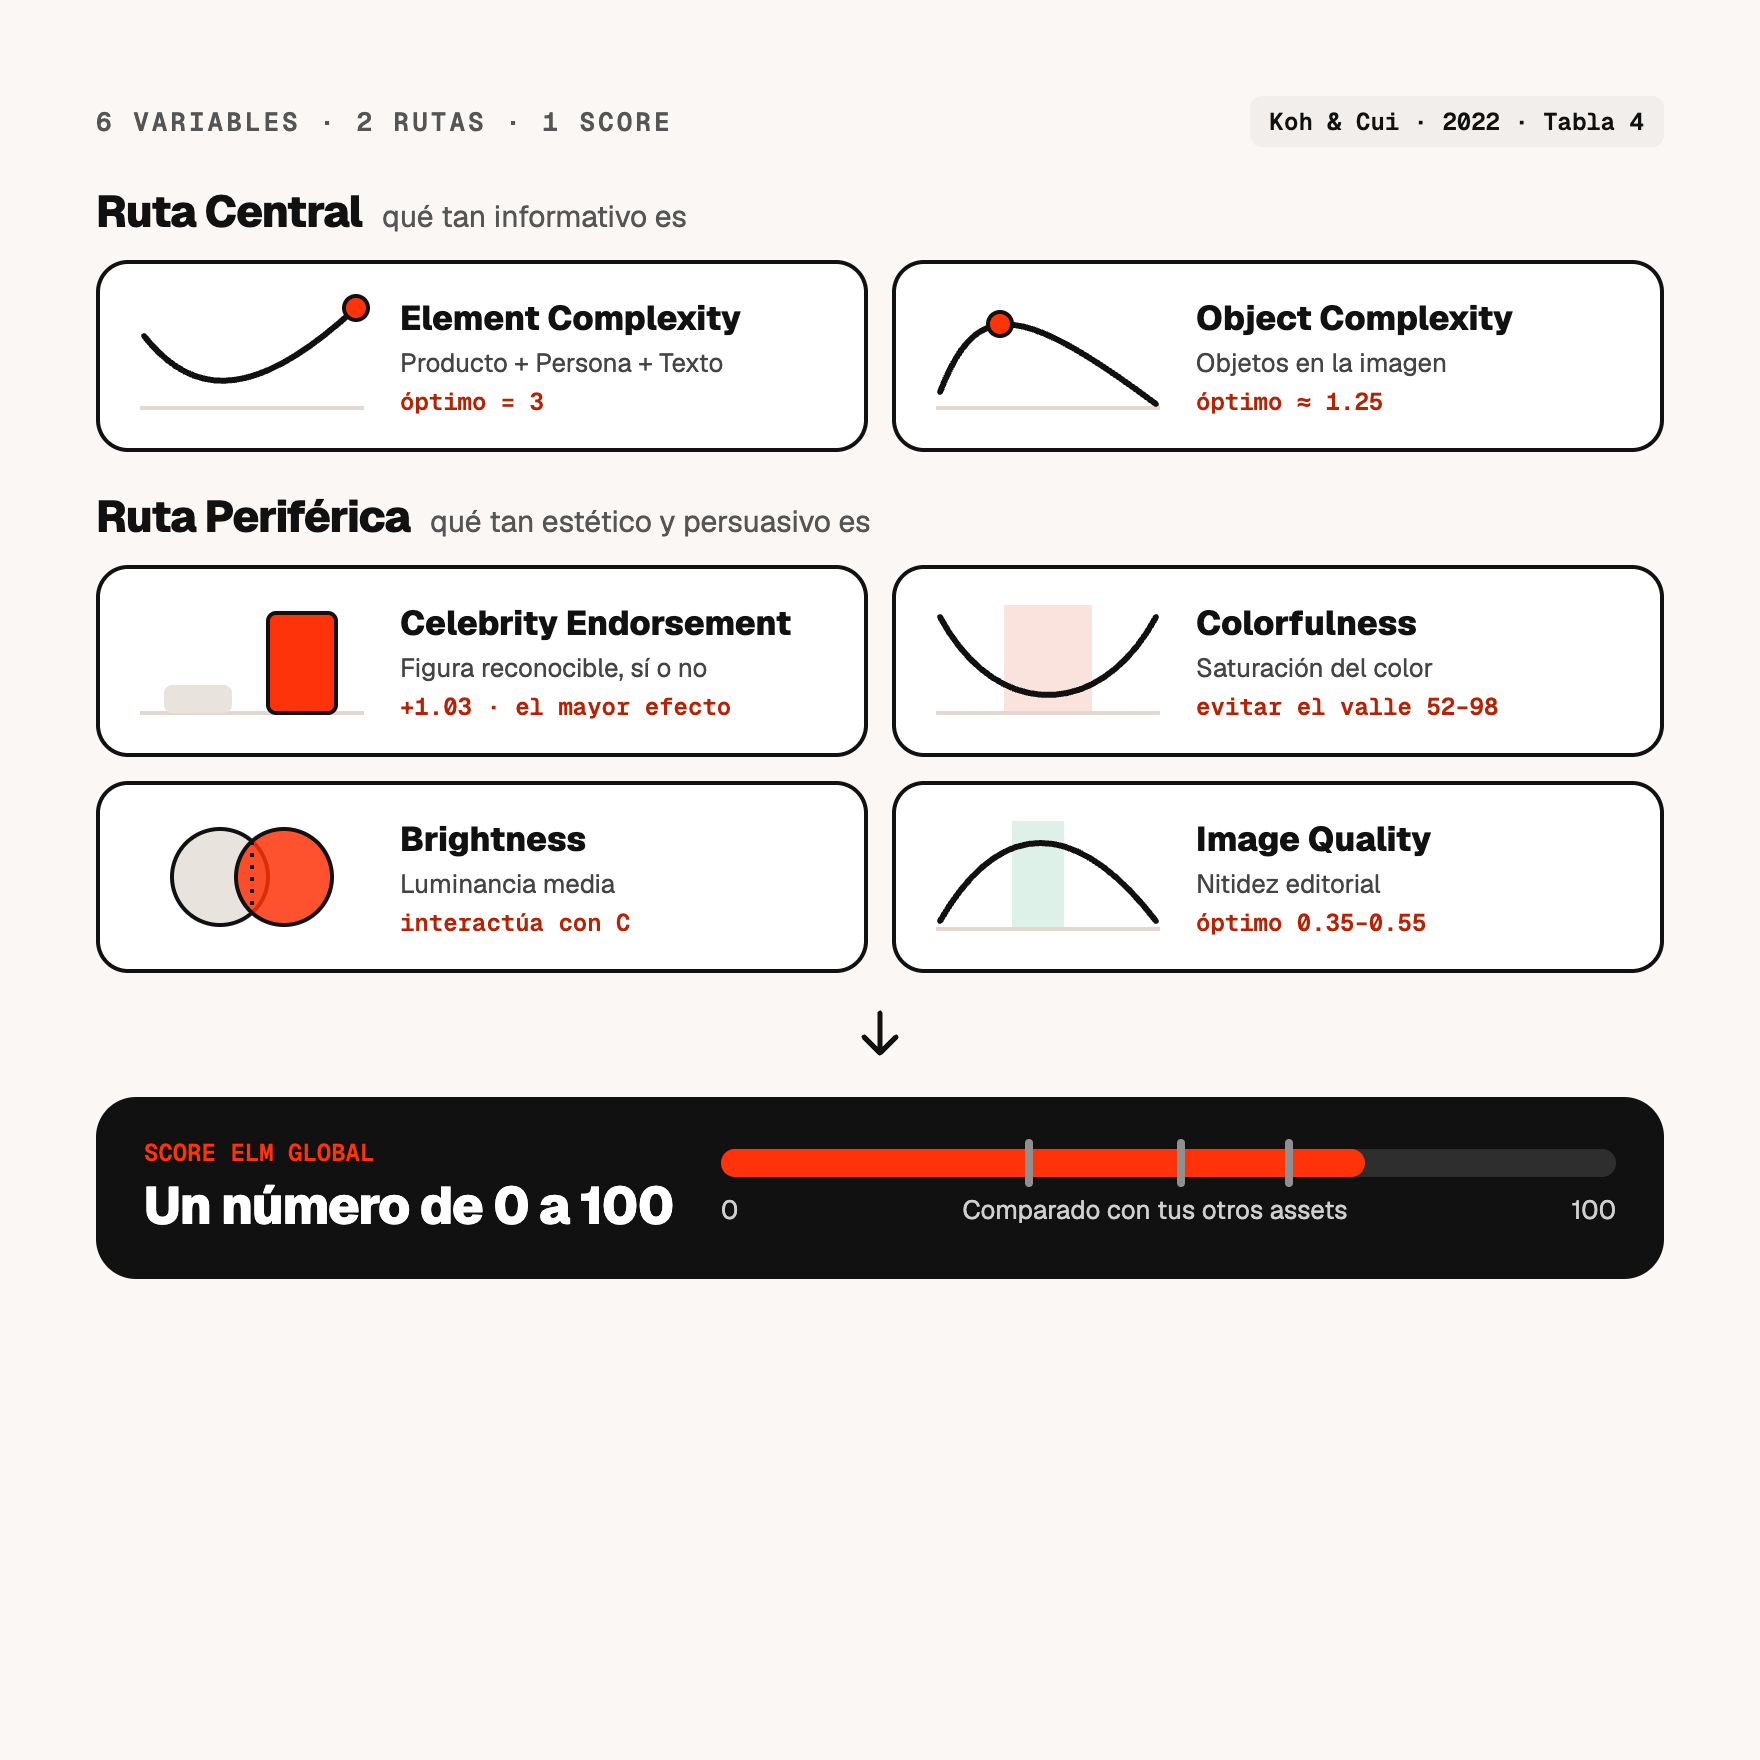
The ELM Score applies the Elaboration Likelihood Model by Koh & Cui (2022) to a thumbnail. Six measurable visual variables, grouped into two routes — Central Route (how informative it is) and Peripheral Route (how aesthetic and persuasive it is) — are combined into a single number from 0 to 100 that you can compare across your own channel's assets.
The score's variables come from an academic paper: An Exploration of the Relation between the Visual Attributes of Thumbnails and the View-Through of Videos (Koh & Cui, 2022). That is the empirical basis of every recommendation; what thumbiq adds is how it is applied, calibrated to your channel and translated into concrete actions.
How much information the thumbnail conveys and how many elements compete for attention.
How many types of element it communicates at once: product, person and text. The model rewards the complete thumbnail — the highest point is reached when all three coexist.
How many objects compete for attention within the frame. Too few bore; too many overwhelm.
The visual appeal and the weight of a recognizable figure, beyond the information it contains.
The presence of a figure your audience recognizes instantly. It is the most heavily weighted variable in the model: on its own it can multiply projected views by ~2.8×. Not every familiar face counts — it is evaluated against your audience's real recognition.
How vivid or muted the colors are. The model penalizes the middle zone — neither subdued nor explosive — and favors the extremes.
The overall luminosity of the image and how it interacts with color.
Sharpness and cleanliness of the image: neither too artificial nor degraded.

A 75 on your channel is not the same as a 75 on another: the scale is calibrated to each history. That's why we never compare channels with each other.